Employee Turnover Rate: The Formula, Benchmarks by Industry, and How to Actually Reduce It (2026)
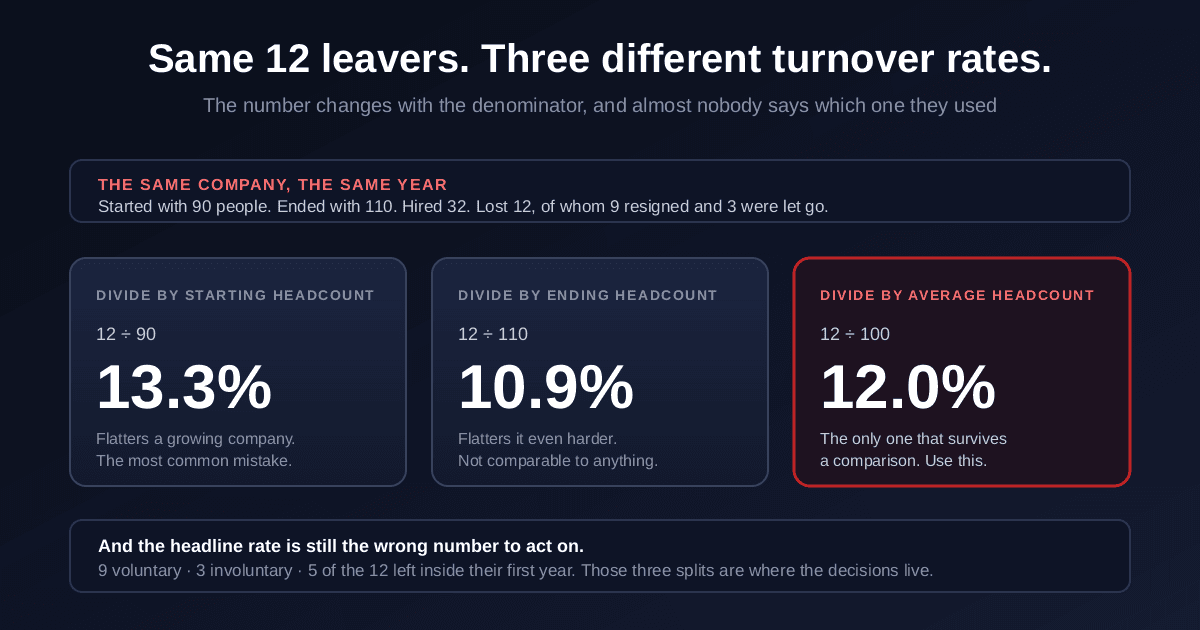
Twelve people left last year. Your headcount went from 90 to 110. So what was your turnover rate? Depending on which number you put underneath the twelve, the honest answer is 10.9%, 12.0% or 13.3%, and every one of those is arithmetically correct. Most companies pick one without noticing there was a choice, then compare the result against a benchmark that used a different one. That is before we get to the harder problem, which is that the headline rate is the wrong number to act on no matter how carefully you calculate it.
Quick answer
Quick answer: employee turnover rate = (separations during the period / average headcount during the period) x 100. Use the mean of your month-end headcounts as the denominator, not your starting or ending figure. Then split the result four ways before you act on it: voluntary vs involuntary, regrettable vs not, first-year vs later, and by team and manager. A good rate depends entirely on your industry, from around 18% in government to 70% or more in hospitality. If half your leavers go inside twelve months, you do not have a retention problem, you have a hiring problem.
What is employee turnover?
Employee turnover is the rate at which people leave an organisation over a defined period and have to be replaced. It counts separations, which means every person whose employment ended: resignations, retirements, redundancies, dismissals and expired contracts.
Three inclusion rules decide whether your number means anything, and they are worth writing down once:
- Count people, not roles. One role that churns through three people in a year is three separations, not one.
- Exclude internal moves. Somebody transferring from support into sales has not left. Counting them inflates turnover while hiding the fact that your internal mobility is doing its job.
- Decide once about contractors, interns and seasonal staff, then apply it consistently. Either treatment is defensible. Switching between them mid-year is not.
The word gets used loosely, which is why any turnover rate you quote or receive should arrive with three facts attached: which leavers are in it, which headcount figure is in the denominator, and what period it covers. Without those, two turnover rates simply cannot be compared, and most published comparisons quietly ignore this.
Attrition rate vs turnover rate: what is the difference?
For practical purposes, almost none. Most HR teams and most benchmark reports use attrition rate and turnover rate to mean the same calculation, and if someone hands you an attrition figure your first question should be about the formula rather than the vocabulary.
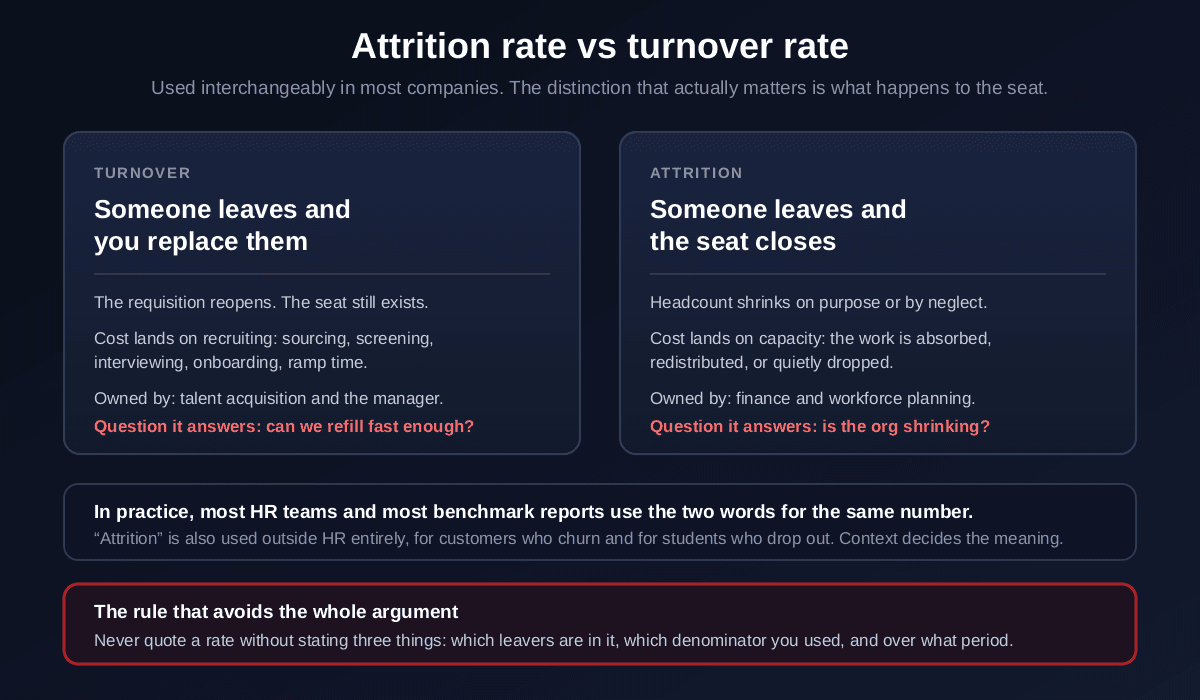
Where a distinction genuinely exists, it is about what happens to the seat. Turnover implies a role that gets refilled, so the cost converts into recruiting workload. Attrition implies a role that closes behind the leaver, so headcount falls and the cost converts into capacity: the work is absorbed by whoever is left, redistributed, or quietly dropped. Under that reading, turnover is a talent acquisition metric and attrition is a workforce planning one.
A third convention exists too, in which attrition means voluntary exits only and turnover means all separations. With three conventions in circulation, arguing about the words is a waste of a meeting. State your formula next to your number and the ambiguity evaporates.
Attrition means something different outside HR
How to calculate employee turnover rate
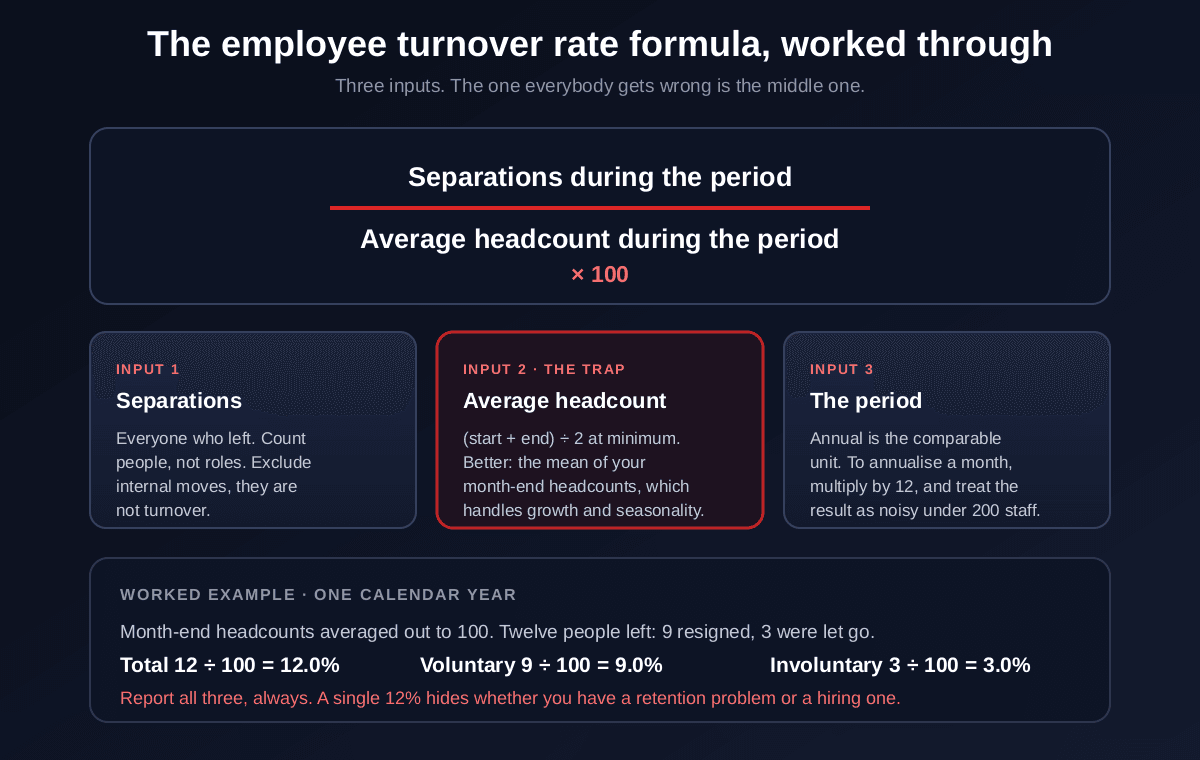
The employee turnover rate formula is: (separations during the period / average headcount during the period) x 100. Three inputs, and the one nearly everybody gets wrong is the middle one.
Count separations, cleanly
Build an average headcount, not a snapshot
Divide, multiply by 100, and state the period
Run the same formula three times
Worked example. Month-end headcounts average out to 100 across the year. Twelve people leave: nine resign, three are let go. Total turnover is 12 / 100 = 12.0%. Voluntary turnover is 9 / 100 = 9.0%. Involuntary turnover is 3 / 100 = 3.0%. Now compare that with the same twelve leavers divided by a starting headcount of 90, which gives 13.3%, or by an ending headcount of 110, which gives 10.9%. Nothing about the company changed. Only the denominator did.
Why the denominator flatters growing companies
Retention rate vs turnover rate: not simply opposites
The retention rate formula is (employees at start who are still there at the end / employees at start) x 100. It is tempting to treat retention as 100 minus turnover, and it is wrong, because the standard retention rate excludes everyone hired during the period while turnover includes every separation regardless of start date.
That gap is a diagnostic rather than a nuisance. Imagine a company that hires 40 people, loses 15 of them within months, and loses nobody from its original staff. Retention reads 100%. Turnover reads something substantial. Both are correct, and read together they say something very specific: your existing people are staying and your new people are not. High retention sitting next to high turnover is close to a definitive signal that you are looking at a hiring problem rather than a retention one.
The four splits worth tracking separately
A single company-wide rate is close to useless on its own. Every one of these cuts routes the problem to a different owner, and each one is a five-minute change to a report.
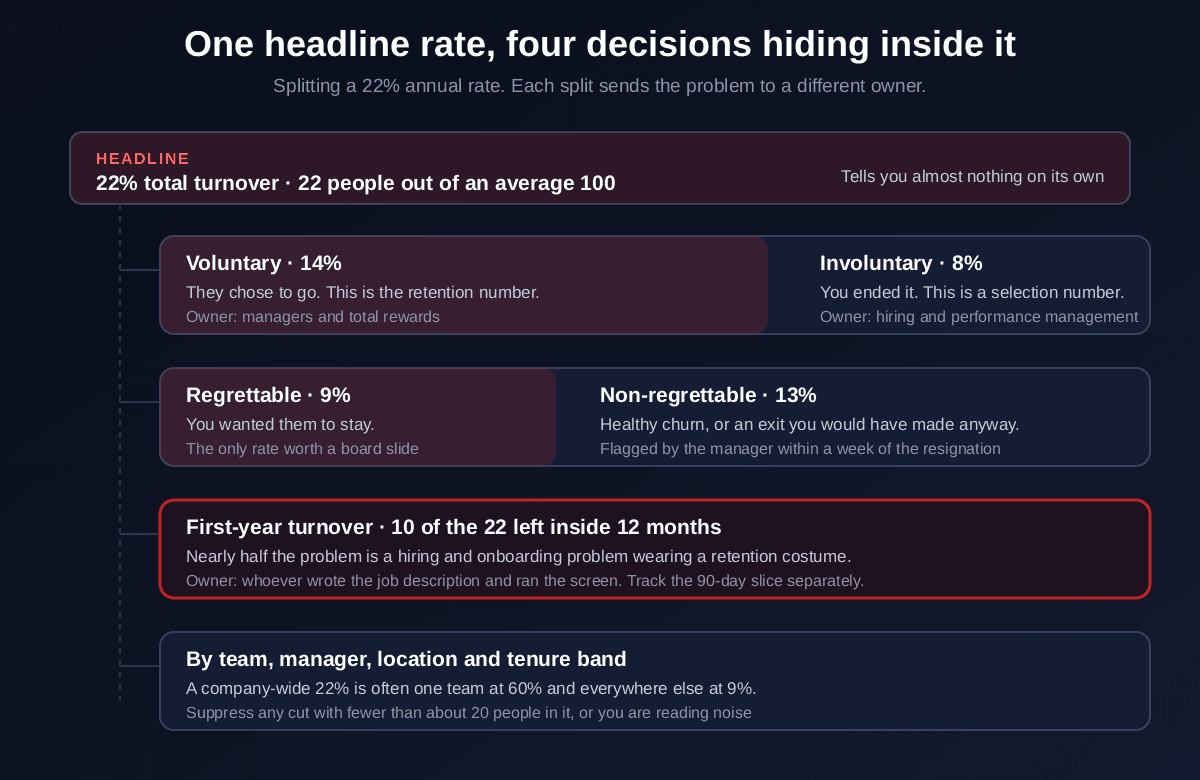
1. Voluntary vs involuntary. Voluntary turnover is your retention signal and points at managers, pay fairness, workload and progression. Involuntary turnover is mostly a selection signal and points back at your job description, your screening criteria and your interview process. A company running 14% voluntary and 8% involuntary has two distinct problems, and an engagement programme addresses at most one of them.
2. Regrettable vs non-regrettable. The most useful cut for a leadership audience, and the one most likely to change a decision. Make the classification mechanical: within a week of the resignation, the manager marks it, and the marking locks so nobody rewrites history after a painful replacement search. A 22% rate that resolves into 9% regrettable describes a company churning through the wrong hires, which is a completely different diagnosis from losing its best people.
3. First-year and 90-day turnover. Track these as their own lines. Early exits are not a retention failure in the usual sense, they are the bill for a hiring and onboarding decision made months earlier. If ten of your twenty two leavers went inside twelve months, nearly half your turnover is a front-of-funnel problem wearing a retention costume.
4. By team, manager, location and tenure band. A company-wide 22% is very often one team at 60% and everywhere else at 9%. Suppress any cut with fewer than roughly 20 people in it, because below that you are reading noise and, in small teams, you are also effectively identifying individuals.
What is a good turnover rate? Benchmarks by industry
There is no universal good number, and any source that offers one without naming an industry is not worth using. Annual total separations in the US vary by a factor of four across sectors.
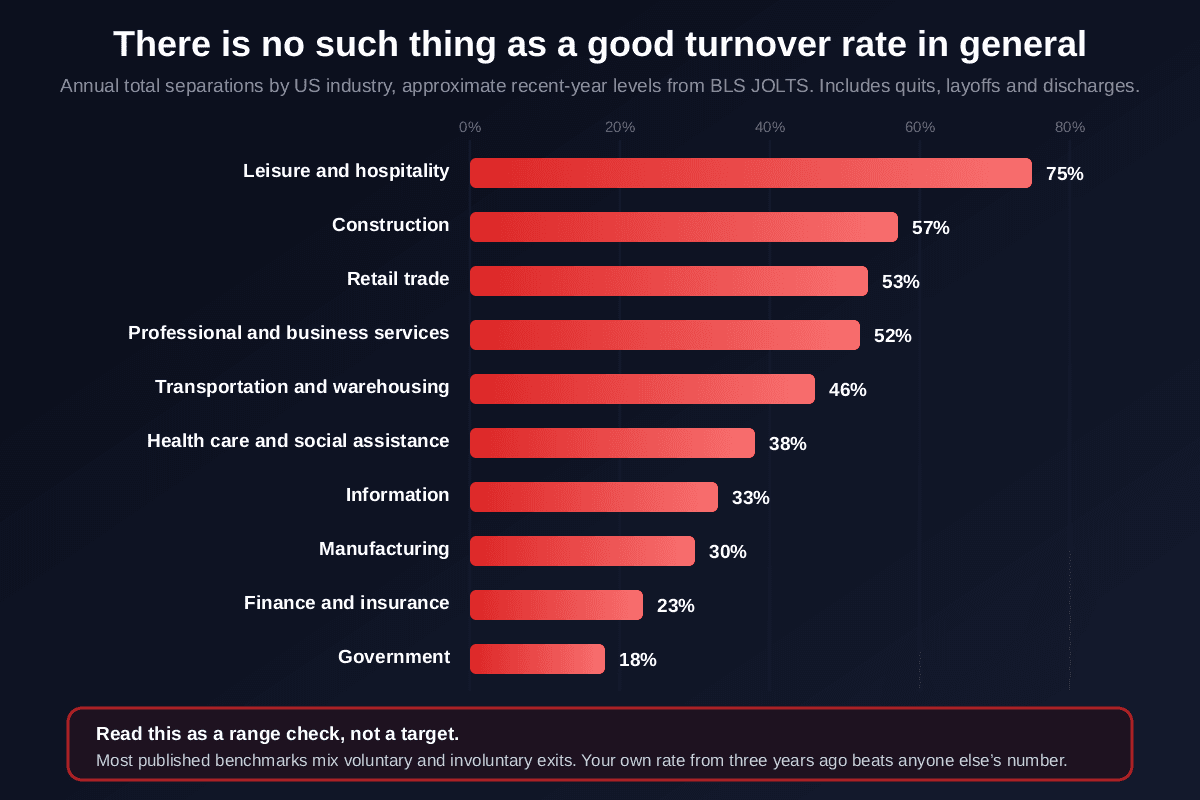
Two warnings about using any chart like this one. First, these are total separations, so they include layoffs and discharges alongside resignations, which is why they run higher than the retention figures HR teams usually quote internally. Second, they are national aggregates: your city, your role family and your pay band can move the realistic range substantially.
The more useful test has nothing to do with beating a benchmark. Three questions:
- Is voluntary turnover stable or falling against your own number from last year and the year before?
- Is regrettable turnover a small share of the total? A company at 25% total with almost no regrettable exits is healthier than one at 12% that is losing its strongest engineers.
- Is anything clustering? One manager, one tenure point, one location, one demographic group. Concentration is the signal; the average is the thing that hides it.
A high turnover rate is not automatically a bad one
What does employee turnover actually cost?
The figure quoted most often is one half to two times the departing employee's annual salary, and the range is that wide because most of the cost never appears on an invoice. It breaks into three layers.
Direct replacement costs are the visible layer and usually the smallest: advertising, agency fees, recruiter hours, interview time across several people, background checks, onboarding and equipment. Your own cost per hire figure already contains most of this, which makes it the honest starting point rather than a benchmark you found online.
Lost productivityis the large layer. It starts before the resignation, during the period when somebody has mentally left, continues through the vacancy, and does not end on the replacement's first day. For a skilled role the full arc from disengagement to a fully effective replacement commonly runs six to twelve months, and a structured first 90 days is the main lever on the back half of it.
Second-order effects never make it into a spreadsheet and are frequently the largest of all: the overtime absorbed by the remaining team, the projects that slip, the customer relationships that reset, the undocumented knowledge that walks out, and the way one departure prompts colleagues to update their own resumes. When one exit is followed by two more from the same team within a quarter, you are watching this layer.
Build the number from your own inputs
Why people actually leave
Roughly in order of how often they show up in exit data: the relationship with the direct manager, no visible progression, pay that feels unfair, workload and burnout, a job that turned out to be different from the one described at interview, weak onboarding, and a fit problem that better screening would have caught.
Two of those are read wrongly almost everywhere.
Pay is over-diagnosed and mis-diagnosed. It is the safest thing for a leaver to say, so it gets said constantly, and the driver is more often perceived unfairness in how pay is decided than the absolute figure. That is why a market adjustment sometimes fails to stop the leaks: it answers a question nobody was really asking. The diagnostic question in an exit interviewis not "was pay a factor" but "was it the amount, or how it was decided?"
The job-was-not-the-job cause is under-reported. It is embarrassing to say out loud, easy to relabel as a growth opportunity on a form, and it is the cheapest cause on the list to fix. Splitting leavers by tenure exposes it immediately: exits inside the first year trace back to hiring and onboarding, exits after three years trace back to progression. Those need entirely different programmes, and most retention initiatives only address the second.
How to reduce employee turnover, ranked by leverage
The strategies that work depend on which turnover you have, which is why the splits above come first. Spending a retention budget before running that analysis is how companies end up funding an engagement survey to solve a screening problem.
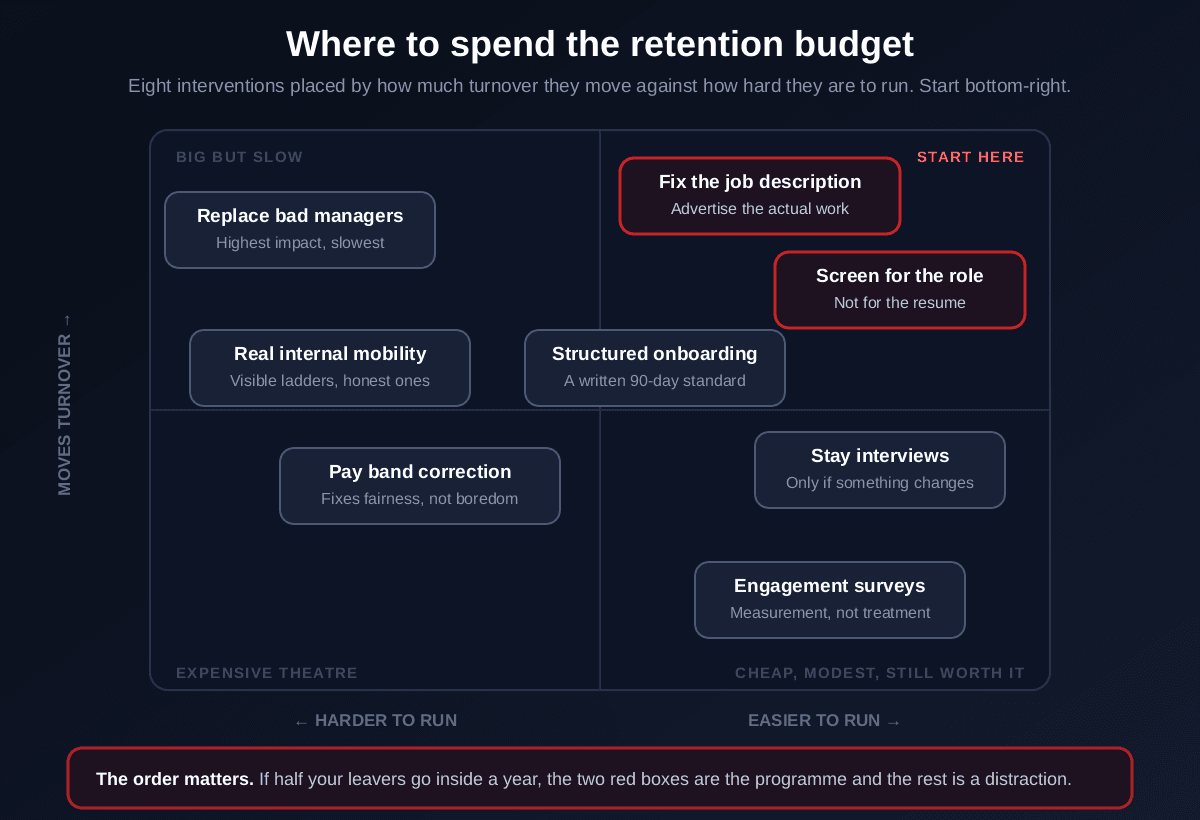
Advertise the actual job. The cheapest intervention on the chart and the one most often skipped, because rewriting a posting feels too small to count as a retention strategy. It is not. A job description describing an aspiration rather than the work generates first-year exits eighteen months later, and no amount of engagement spending recovers them.
Screen for the role, not for the resume. Involuntary turnover and early voluntary exits are both selection failures, and both are decided at the shortlist. Define the three or four requirements that actually predict performance in the role, score every applicant against those, and stop letting polish substitute for fit. Our guides to screening criteria and skills-based hiring cover the mechanics.
Give the first 90 days a written standard. Not a welcome pack. A short document saying what good looks like at day 30, 60 and 90, who owns it, and when it will be reviewed. Structured onboarding is the highest-return fix available for the first-year cluster, and it costs a manager an afternoon per hire.
Fix the manager, or move them. Consistently the largest single lever and the slowest to pull. A turnover report cut by manager finds these people in an afternoon. What to do afterwards is the hard part, and a properly run improvement plan is usually the honest path.
Make internal mobility real. People leave to get the job you could have given them. Visible ladders, a genuine internal posting process, and managers who are not punished for losing good people to other teams. This one fails quietly whenever internal applicants are treated worse than external ones.
Correct pay bands, but for fairness first. A band correction fixes perceived unfairness, which is a real cause. It does not fix boredom, a bad manager or a job that was mis-sold, and it is expensive enough that spending it on the wrong diagnosis hurts.
Run stay interviews, but only if something changes. Ask the exit interview questions of people who have not left, when the answers can still change the outcome. The rule that decides whether it works: a stay interview producing no visible action teaches people that speaking up is pointless and accelerates the exit it was meant to prevent.
Engagement surveys are measurement, not treatment. Useful for locating a problem, incapable of solving one. A company on its fourth annual survey with no structural change to show for it has taught its staff exactly what the survey is for.
If half your leavers go inside a year, fix the screen before the survey
First-year turnover is a hiring decision arriving late. Upload your applicant batch and paste the job description, and Rankid scores every candidate 0 to 100 against the role's real requirements, so your shortlist is built on fit rather than resume polish. Up to 200 resumes per batch, first 5 free, no signup.
Score your applicant pool freeFirst-year turnover is a hiring problem
This deserves its own section because it is where most turnover programmes aim at the wrong target. When someone leaves within twelve months, the decision that produced the exit was made before they started, and it was usually one of three:
- The posting described a job that does not exist. Aspirational scope, a title one level above the reality, or responsibilities that belong to a role you have not funded yet.
- The screen selected for the wrong thing. Keyword density, brand names and formatting rather than the two or three capabilities the role genuinely requires. This is also how strong candidates get filtered out, which is the same failure viewed from the other side.
- The interview never tested the actual work. A fixable gap, and an interview scorecard is the standard fix, because it forces the panel to agree in advance on what they are assessing.
The tell is in your own data and takes ten minutes to find. Plot separations by tenure band: 0 to 3 months, 3 to 12, 1 to 3 years, 3 years and over. A spike in the first two bands is a front-of-funnel problem. A flat distribution with a bulge after three years is a progression problem. They rarely coexist at the same severity, and knowing which one you have decides where the budget goes. Our guides to the hiring process and recruitment metrics cover the upstream measurements that pair with this.
Turnover in healthcare, manufacturing, retail and call centres
High-turnover sectors are not simply low-turnover sectors doing it badly. The mechanics differ, and so do the fixes that move the number.
Healthcare. Turnover concentrates in the first year and in shift-heavy roles, and it is driven by scheduling, ratios and burnout more than by pay. The interventions with evidence behind them are unglamorous: predictable rosters published further ahead, a named preceptor for every new starter, and a realistic job preview during hiring so the shift pattern is not a surprise in week two.
Manufacturing and warehousing. The 90-day window dominates, and a large share of exits happen in the first fortnight. Reducing them is mostly operational: a functioning first-day experience, a trained buddy on the line, transport and shift logistics that work, and screening that checks the physical and scheduling realities honestly rather than hoping.
Retail and hospitality. Structurally high, partly seasonal, and the useful target is not the headline rate but the share of leavers you wanted to keep, plus the speed of your refill. This is a high-volume recruiting problem as much as a retention one, and a permanent talent pipeline beats a fresh scramble every quarter.
Contact centres. Famous for it, and the pattern is consistent: a sharp early cliff driven by the gap between the advertised job and the reality of the queue, followed by a second cliff around the point where progression should have appeared and did not. Both are addressable, and both are addressed before anyone is hired.
How to report turnover so somebody acts on it
Most turnover reporting fails for the same reason most exit interview programmes fail: the number is produced, circulated and never converted into a decision. A one-page monthly report that gets acted on contains five things and nothing else.
- Three headline lines on one chart: total, voluntary and regrettable turnover, rolling twelve months, with the same three lines from last year behind them.
- A tenure distributionof this period's leavers, in four bands. This is the chart that tells you whether you are looking at a hiring problem or a retention one.
- A ranked cut by team or manager, suppressed below about 20 people, showing only the top and bottom three.
- The top three coded reasons, from a fixed list rather than free text. Prose cannot be counted, so free-text exit feedback never becomes a pattern.
- One decision. What changed since last month, and what will change before the next one. A report without this line is a newsletter.
Two operational notes. Lock the definitions in writing and version them, because a quiet change to who counts as a separation makes every prior year uncomparable. And publish the tenure distribution to hiring managers specifically, since they are the people who can act on the first-year cluster and usually the last to see it.
The mistakes that make a turnover number useless
- Dividing by starting or ending headcount. Flatters growing companies and makes year-on-year comparison meaningless.
- Reporting one blended rate. Voluntary and involuntary have different owners and different fixes. Blended, they cancel each other out into a number nobody can act on.
- Counting internal transfers as leavers. Penalises the internal mobility you are trying to build.
- Comparing against a benchmark with a different formula. Most public figures include layoffs. Most internal ones do not.
- Annualising a small monthly number. Under 200 employees, one resignation moves the annualised rate by a full point. Use rolling twelve months instead.
- Slicing until the groups are tiny. Below about 20 people per cut you are reading noise, and you are also identifying individuals.
- Letting managers re-mark regrettability later. Once a replacement search goes badly, every exit becomes regrettable in hindsight.
- Treating every exit as a failure. Some turnover is healthy, and a target of zero produces worse decisions than a target of stability.
- Measuring for three years without changing anything. The most common failure of all, and the one that teaches an organisation to stop taking the number seriously.
Reading the number backwards into the hire
Turnover is a lagging indicator of decisions made a long way upstream. By the time a resignation lands, the useful choices, about what the job actually is, who was shortlisted, what the interview tested and what the first 90 days looked like, were all made months or years earlier.
That is what makes the tenure distribution the single most valuable chart in the whole exercise. If your leavers skew early, the highest-return work is not a retention programme at all. It is at the front of the funnel: a posting that describes the real job, a shortlist built against the requirements that predict performance, and an interview that tests the work. Our guides to candidate experience and screening interviews cover the two stages where most of that damage is done or avoided.
Key takeaways
- Employee turnover rate = (separations / average headcount) x 100. Use the mean of month-end headcounts, never the start or end figure.
- The same 12 leavers can read as 10.9%, 12.0% or 13.3%. Always state the denominator alongside the number.
- Attrition rate and turnover rate mean the same thing to most teams. Where they differ, it is whether the vacated seat gets refilled.
- Retention rate is not 100 minus turnover: it excludes anyone hired during the period. High retention plus high turnover means a new-hire problem.
- Split every rate four ways: voluntary vs involuntary, regrettable vs not, first-year vs later, and by team and manager.
- There is no good rate in general. US annual separations run from around 18% in government to 70% or more in hospitality.
- Turnover typically costs half to two times annual salary, and most of that is lost productivity rather than recruiting spend.
- Pay is over-reported as a cause. Perceived unfairness in how pay is decided drives more exits than the absolute number.
- First-year exits are a hiring and onboarding bill, not a retention failure. Fix the posting, the screen and the first 90 days.
- Suppress cuts below about 20 people, lock your definitions in writing, and end every turnover report with one decision.
The whole exercise reduces to one question you can ask of any turnover report: does this number tell me who should do something differently? A single company-wide percentage never does. A voluntary rate, cut by tenure band and by manager, always does. And when the answer comes back that most of your leavers went inside their first year, the fix is not a retention programme at all. Paste your job description and your applicant batch into Rankid's bulk resume screening and start by making sure the people you shortlist match the job as it actually exists.
Frequently asked questions
What is employee turnover?
Employee turnover is the rate at which people leave an organisation over a defined period and have to be replaced. It counts separations, meaning every person whose employment ended, whether they resigned, retired, were made redundant or were dismissed. It does not count internal moves: someone who transfers from support to sales has not left, and counting them inflates your number while hiding the fact that your internal mobility is working. Turnover is normally expressed as an annual percentage of average headcount, so a company averaging 100 employees that loses 12 people in a year has 12% annual turnover. The word is used loosely in practice, which is why any number you quote or receive should be accompanied by three facts: which leavers are included, which headcount figure sits in the denominator, and what period it covers. Without those, two turnover rates cannot be compared, and most published comparisons quietly ignore this.
What is attrition rate, and what does it mean?
Attrition rate is the percentage of people who leave a defined group over a period. In an HR context it usually means the same thing as employee turnover rate and the two words are used interchangeably by most teams and most benchmark reports. Where people do draw a distinction, it is about what happens to the vacated seat: turnover implies the role is refilled, while attrition implies the headcount shrinks because the position is closed or simply never backfilled. That distinction matters more to finance than to recruiting, because attrition in the strict sense reduces capacity permanently while turnover converts into recruiting workload. Outside HR the word is broader still: customer attrition means churn, and in education or training it means the share of people who drop out before finishing. Because the definition is not standardised, the safe move is to state your formula rather than assume the reader shares it.
How do you calculate employee turnover rate?
Divide the number of separations during the period by the average headcount during the same period, then multiply by 100. The formula is (separations / average headcount) x 100. The input that decides whether your number is meaningful is the denominator: use the average of your month-end headcounts rather than your starting or ending figure, because in a growing or shrinking company those two produce materially different answers from identical data. As a worked example, a company whose month-end headcounts average 100 and which loses 12 people in the year has 12.0% annual turnover. Dividing the same 12 by a starting headcount of 90 gives 13.3%, and by an ending headcount of 110 gives 10.9%. All three are arithmetically correct and only the average-headcount version can be compared with anything. Calculate the total, voluntary and involuntary rates from the same denominator and report all three together.
What is a good employee turnover rate?
There is no universal good number, and any source quoting one without naming an industry is not worth using. Annual total separations in the US run from roughly 18% in government and low twenties in finance and insurance up to around 50% in retail and professional services and roughly 70 to 80% in leisure and hospitality, according to the pattern in BLS JOLTS data. Those figures include layoffs and discharges as well as resignations, which is why they look higher than the retention numbers HR teams usually quote internally. The practical test is not whether you beat a benchmark but whether three things are true: your voluntary rate is stable or falling year on year, your regrettable turnover, meaning the people you wanted to keep, is a small share of the total, and your first-year turnover is not clustering. A company at 25% total turnover with almost no regrettable exits is in better shape than one at 12% that is losing its best engineers.
What is the difference between attrition and turnover?
Functionally, very little, and in most organisations the two words describe the same calculation. The distinction people reach for when pressed is this: turnover describes a person leaving a role that will be refilled, so the cost lands on recruiting as sourcing, screening, interviewing, onboarding and ramp time. Attrition describes a person leaving a role that closes behind them, so headcount falls and the cost lands on capacity, because the work is absorbed by others, redistributed or quietly dropped. Under that reading, turnover is a talent acquisition metric and attrition is a workforce planning one. Some organisations also use attrition to mean only voluntary exits and turnover to mean all separations, which is a third convention entirely. Since three conventions are in circulation, arguing about the words is unproductive. State the formula and the inclusion rules next to the number and the ambiguity disappears.
What is the difference between voluntary and involuntary turnover?
Voluntary turnover is people who chose to leave: resignations, retirements and people who moved on for study, relocation or family reasons. Involuntary turnover is separations the employer initiated: dismissals for performance or conduct, end of a fixed contract, and redundancy. They belong to different owners and demand different fixes, which is why blending them into a single headline rate destroys the information. Voluntary turnover is your retention signal and points at managers, pay fairness, workload and progression. Involuntary turnover is largely a selection signal and points back at hiring: at the job description, the screening criteria and the interview process that let a poor fit through. A company with 22% total turnover made up of 14% voluntary and 8% involuntary has two separate problems running at once, and a programme aimed only at engagement will address at most one of them.
What is regrettable turnover?
Regrettable turnover counts only the people you would have kept if you could, and it is the single most useful cut of the number for a leadership audience. The classification is subjective by nature, so make it mechanical: within a week of a resignation, the manager marks it regrettable or non-regrettable, and the marking is locked so nobody rewrites history after a difficult replacement search. Reporting it changes the conversation completely, because a headline rate of 22% that resolves into 9% regrettable and 13% non-regrettable describes an organisation that is churning through the wrong hires rather than failing to hold on to its best people. Track the two lines on the same chart over time. If regrettable turnover is flat while total turnover is falling, your retention programme is congratulating itself for losing fewer people it did not want.
How much does employee turnover cost?
The widely cited range is one half to two times the departing employee's annual salary, and the spread is that wide because most of the cost is not the recruiting invoice. Direct replacement costs, meaning advertising, agency fees, recruiter time, interview hours and onboarding, are the visible part and typically the smaller one. The larger part is productivity: the gap between the leaver checking out mentally and the replacement reaching full effectiveness, which for a skilled role commonly runs six to twelve months in total. Then there are the second-order effects that never appear in a spreadsheet, including the overtime absorbed by the team, the projects that slip, the customer relationships that reset and the knowledge that walks out undocumented. To make the number credible internally, build it from your own inputs: your real cost per hire, your real time to productivity, and the salary bands of the people who actually left rather than an average across the company.
What are the main causes of employee turnover?
In rough order of how often they appear in exit data: the relationship with the direct manager, a lack of visible progression, pay that feels unfair rather than merely low, workload and burnout, a job that turned out to be different from the one described at interview, weak onboarding, and a poor fit that better screening would have caught. Two of those are widely misread. Pay is named constantly, but the driver is more often perceived unfairness in how pay is decided than the absolute figure, which is why a market adjustment sometimes fails to stop the leaks. And the job-was-not-the-job cause is systematically under-reported, because it is embarrassing for the employee to say and easy to relabel as a growth opportunity in an exit form. Splitting your leavers by tenure exposes it immediately: exits inside the first year usually trace back to hiring and onboarding, while exits after three years usually trace back to progression.
How do you reduce employee turnover?
Start by finding out which turnover you have, because the fixes do not overlap. If a large share of leavers go inside their first year, you have a hiring and onboarding problem, and the highest-return work is upstream: describe the actual job in the posting, screen against the requirements that predict performance rather than against resume polish, and give every new hire a written standard for their first 90 days. If your leavers are long-tenured, you have a progression problem, and the fixes are internal mobility that visibly works, honest career ladders, and pay bands that survive being explained out loud. Underneath both, the manager relationship is the largest single lever and the slowest to move. Two things to avoid: launching an engagement survey and calling it a retention programme, since measurement is not treatment, and running stay interviews without acting on them, which teaches people that speaking up is pointless and accelerates the exits you were trying to prevent.
What is the retention rate formula, and is it just the opposite of turnover?
Retention rate is the percentage of employees present at the start of a period who are still employed at the end of it: (employees at start who remain / employees at start) x 100. It is not simply 100 minus turnover, and treating it as such is a common reporting error. The difference is that the standard retention rate excludes anyone hired during the period, while turnover includes every separation regardless of when the person joined. A company that hires 40 people, loses 15 of them within months and loses nobody from its original staff will report 100% retention and a substantial turnover rate at the same time, and both numbers are correct. That gap is diagnostic rather than annoying: a high retention rate sitting alongside high turnover is close to a definitive signal that your problem is new hires, which means it is a hiring problem.
Is a high turnover rate always bad?
No, and treating every exit as a failure leads to bad decisions. Some turnover is healthy: it moves people who were not thriving into roles that suit them better, opens promotion paths for the people below them, and brings in outside experience. Some is structural and beyond your control, including seasonal work, student workforces and roles that everybody understands to be a two-year stepping stone. A rate of zero would be a warning sign in most organisations, because it usually means nobody can move. What is genuinely bad is concentration. Turnover clustered in one team, under one manager, at one tenure point, or among your strongest performers is a signal regardless of how the company-wide average looks. This is why the aggregate is close to useless on its own, and why the first thing to do with a turnover number is break it apart by team, manager, tenure band and regrettability.